
Commercial Passenger Aviation is a complex matter. Successful ground operations require the coordination of a virtually endless number of processes. Further complicating the matter are disruptions which are part of the daily business. Unpredictable external changes and operational irregularities often need to be resolved within seconds. Any disruption in a single process can trigger a ripple effect which may cause delays in multiple other processes. As airline passengers, we all know the pain of waiting at the airport for a delayed flight. The passengers’ negative reactions very real and the frustration completely understandable. Their response is only made even more understandable when you consider the various reasons for their journeys which range from from visiting loved ones, celebrating a holiday or an important business meeting. But, what about the impact of delays on the airlines? Specifically, let’s consider and examine the numbers and the monetary effects delays have on airlines. We all know the saying, “Time is money.” The following calculations demonstrate just how true this is, especially in Commercial Passenger Aviation.
Facts and figures
First of all, what is it that we call a delay? Flights that depart within a 15-minute range of their scheduled time are considered on-time. The following calculations focus on flights with a delay of more than 15 minutes. To analyze the effect on airlines business, our calculations are based on average numbers relating to number of flights and on-time performance (OTP).
We are focusing on the three (3) largest U.S. carriers to evaluate the costs per delay and how painful this is for these airlines. Given the size and number of operations for the “Big 3,” the data basis established here will consist of:
- Average flights per month: 167,073
- Average OTP: 79.07%
This means, we are examining approximately 34,968 delayed flights every month. Keeping in mind the previously noted definition of a delay, the question quickly arises as to, how long is the average delay? The average delay on departing flights is 12.4 minutes. That means the average delayed flight departs 12.4 minutes after the 15-minute “grace period”, following a flight’s scheduled departure time. Complicated? Yes! To make it easier, let’s disregard the 15-minute tolerance and take the 12.4 minutes as the total average delay duration. Summed up, we are roughly looking at almost half a million (433,604) minutes every month based on our estimates above. That´s impressive on its own and will become even more imposing taking into account that each minute of delay costs the airline $74.20 USD. These costs have been increasing increasing over 9% since 2017.
Significant numbers? Here is the overview:
- Average delay: 12.4 minutes
- Cost per minute: $74,20 USD
- Average number of delayed flights per month: 34.9
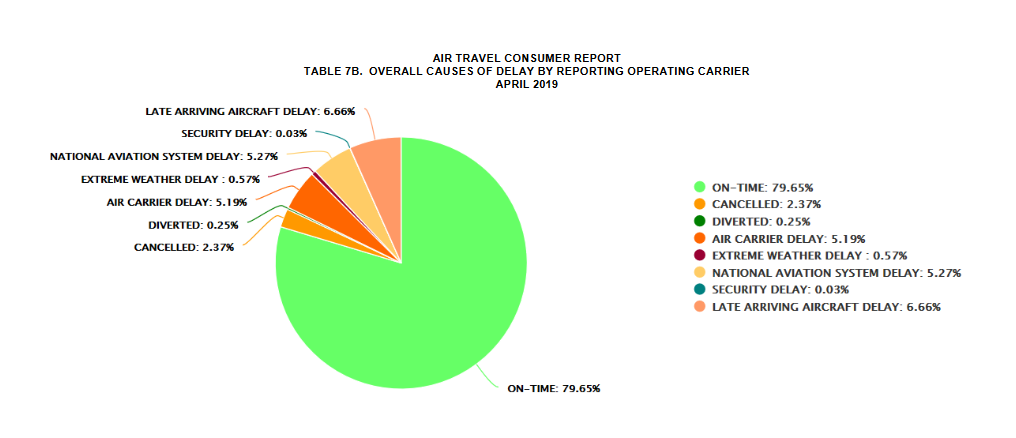
The reasons behind a delay
There are several reasons why a flight’s departure is delayed. Some are – more or less – in the hands of the airline, which are summarized under “air carrier delay” in the following graphics which contains events such as maintenance or crew-related problems, while others resulting from extreme weather or national aviation system delays are obviously not. That means that only 25.50 % of the occurring delays are related to the airline’s operations.
The costs
The average delay costs $920,08 USD per flight. The cost drivers are fuel, crew, maintenance, aircraft ownership and others. Fuel and the crew costs are, by far, the major cost driver with $27,01 USD and $23.35 USD representing more than 75% of the total portion.
That means there is an incredible amount of $32,173,706 USD imputed cost per month on average which the three (3) largest US airlines face. To put these numbers in perspective, in one (1) year, this equals the cost of an Airbus 350-1000 or a Boeing 777-300ER!
If we take into consideration the statistics relating to the delays reasons as mentioned above, we end up with $8,204.295 USD monthly costs attributed to airline controllable delays. That is still an impressive number, which includes a positive consideration paradoxically, as that this is the area an airline can improve by themselves.
The math
Focusing only on the delay costs that are airline controllable and now assume that those could be reduced by two (2) minutes per delay:
| Actual | Optimized | |
| Minutes of average delay | 12.4 | 10.4 |
| Cost per delay | $920,08 USD | $771,68 USD |
| Air carrier part | $234,62 USD | $196,78 USD |
| Total average cost per month: | $8,204,295 USD | $6,880,947 USD |
| Monthly savings: | $1,323,348 USD |
Accumulated to one (1) year this would save the carrier approximately $15.9 Million USD.
Let´s take it a bit further and suggest that this improvement also affects the remaining delay costs. To maintain the transparency, the next overview will assume that the reduction of the air carrier delays affects the overall delays which are now decreasing by one (1) minute.
| Optimized | Actual | |
| Minutes of average delay | 11.4 | 12.4 |
| Cost per delay | $845,88 USD | $920,08 USD |
| Total average cost per month: | $29,578,732 USD | $32,173,706 USD |
| Monthly savings: | $2,594,974 USD |
This would result in a calculated revenue increase of $31.1 Million USD per year.
The solution?
Optimization of processes and the efficient use of resources and data analytics are the keys, areas on which most air carriers are already focusing. Thanks to “Machine Learning” and Artificial Intelligence (AI), airlines are using “big data” analytics to continuously improve on-time performance.


0 comments on “Flight Delays in Numbers – Not Only Painful For Passengers”