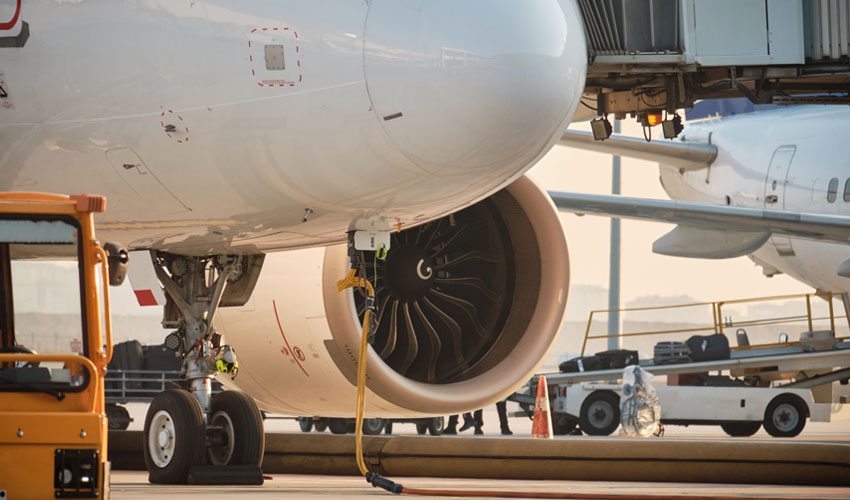
It was a mixed bag for airlines as we closed out the first quarter. They made major strides toward reaching net zero emission goals but continued to struggle with aircraft turnarounds. Air cargo volumes are still making news and there are some airports that are recording the highest volumes.
Airports Record Significant Reductions in CO2 Emissions
The Airport Council International (ACI) recently released data indicating that airports have been taking measures to reduce their CO2 emissions. During the period from May 2021 to May 2022, airports that are accredited through the ACI’s Airport Carbon Accreditation program, collectively reduced their CO2 emissions by 549,643 tons. This represents an 8.1% reduction and the largest achieved through the program. In the reporting period, there were 322 airports accredited through the program.
The United Nations Framework Convention for Climate Change (UNFCCC)’s Manager for Programmes Coordination Niclas Svenningsen commented, “The results announced today speak volumes of the global airport industry’s commitment to fighting climate change. Against the backdrop of worsening climate impacts and the window of opportunity to keep the warming below 1.5°C rapidly closing, we need all parts of our global economy to act now.”
ACI Europe Director General Olivier Jankovec credited the Airport Carbon Accreditation program with the strides being made by airports. He stated, “The Airport Carbon Accreditation program is at the heart of what decarbonizing an industry like aviation must be about: aspirational yet deeply practical and actionable, charting not only achievements today, but the way forward for tomorrow.”
The Airport Carbon Accreditation program reflects the diversity of airports now certified. They include airports of all sizes across diverse regions. Among them are large global hubs such as London Heathrow, Istanbul, Doha Hamad International, Singapore-Changi, and Dallas Fort Worth. Also included are capital such gateways as Abidjan, Athens, Amman, Phnom Penh, Quito, and San Jose. Additionally, smaller airports providing service in remote locations, island nations, and popular tourism spots (e.g., Galapagos, Kelowna, Puerto Vallarta, Enfidha Hammamet, Trondheim, and Sunshine Coast) are too among those now certified through the program.
New components of the program’s framework are Level 4 (Transition) and 4+ (Transformation). They require airports to align their carbon management and reduction path with the goals of the Paris Agreement which are to limit global warming to below 2°C; ideally to 1.5°C.
Tackling Aircraft Turnarounds
Achieving optimum aircraft turnarounds is critical to an airline’s overall profitability. It requires expert management of every detail that could impact operational performance. Minutes and even seconds off of an aircraft’s turnaround can represent thousands of dollars in annual savings. Further, cutting just ten minutes off of an aircraft’s turnaround four times a day can enable it to fly 40 more minutes, earning the airline additional revenue. When done over the course of the year, the dollars can really add up. But that is no easy feat when airlines have to contend with many factors both within and not within their control.


OAG, the world’s leading provider of digital flight information, intelligence, and analytics for airports, airlines, and travel tech companies, recently tracked turnaround times for the major U.S. carriers to gain greater insight into their performance against their scheduled turnaround times at their related hub airports. Also considered were aircraft types and their effect on turnaround times. Here’s what OAG found when viewing the airlines’ turnaround performance in March 2023:
- The average turnaround time for Southwest was 52 minutes.
- The average turnaround time for United Airlines was 68 minutes.
- Southwest, United, American, Delta, and JetBlue reported average turnaround times between 59 minutes (Southwest) and 77 minutes (Delta)
- None of the major U.S. airlines met their planned aircraft turnaround schedules with United performing best with an average six-minute difference or almost 10% longer than scheduled, and JetBlue performing worst with a 12-minute difference or an average 19% longer than scheduled variance.
- Narrowbody aircraft outperformed widebody aircraft with a planned average turnaround of one hour with variances for each airline (i.e., United turned its A320s around within 7 minutes of its planned schedule, while JetBlue’s A320s had a 13-minute difference from its planned schedule.
- Widebody aircraft performed poorly in comparison to narrowbodies. For example, American’s and United’s B777Ws had a 56% and 22% variance, respectively.
Airports Handling the Most Cargo
In an International Airport Review article, the world’s top 10 busiest airports in cargo handling for 2022 were identified. They included airports in Asia and North America. Topping the list was Hong Kong International Airport which handled 4,199,196 tons of cargo, followed closely by Memphis International Airport with 4,042,679 tons. Next in the lineup were: Ted Stevens Anchorage International Airport with 3,461,603 tons, Shanghai Pudong International Airport with 3,117, 216 tons, and Louisville Muhammad Ali International Airport with 3,067,234 tons.
All of these airports except Louisville Muhammad Ali saw a decrease in their cargo volumes from the prior year as follows: Hong Kong – 16.4% decrease, Memphis – 9.8% decrease, Ted Stevens Anchorage – 4.3%, and Shanghai Pudong – 21.7%. In contrast, Louisville Muhammad Ali’s cargo volume increased by a modest 0.5%
The other airports rounding out the top 10 busiest in cargo handling were:
- Incheon International Airport – 2, 945856; 11.5% decrease from 2021
- Taiwan Taoyuan International Airport – 2,538,768; 9.7% decrease
- Miami International Airport – 2,499, 837; 0.8% decrease
- Los Angeles International Airport – 2,489,854; 7.6% decrease
- Narita International Airport (formerly known as New Tokyo International Airport) – 2,399,298; 9.3% decrease
>> How do you see the aviation industry developing in the first quarter of 2023? Share your thoughts with us in the comments.


0 comments on “Aviation Wrap-Up April 2023”